This chapter looks at how sociologists study population — its size, growth, composition and movement — and connects raw demographic numbers (birth rate, sex ratio, literacy) to real social processes like patriarchy, poverty, and rural-urban migration in India.
What is Demography?
Demography is the systematic study of population — its size, growth, composition, and distribution. The word comes from Greek: demos (people) + graphein (to describe).
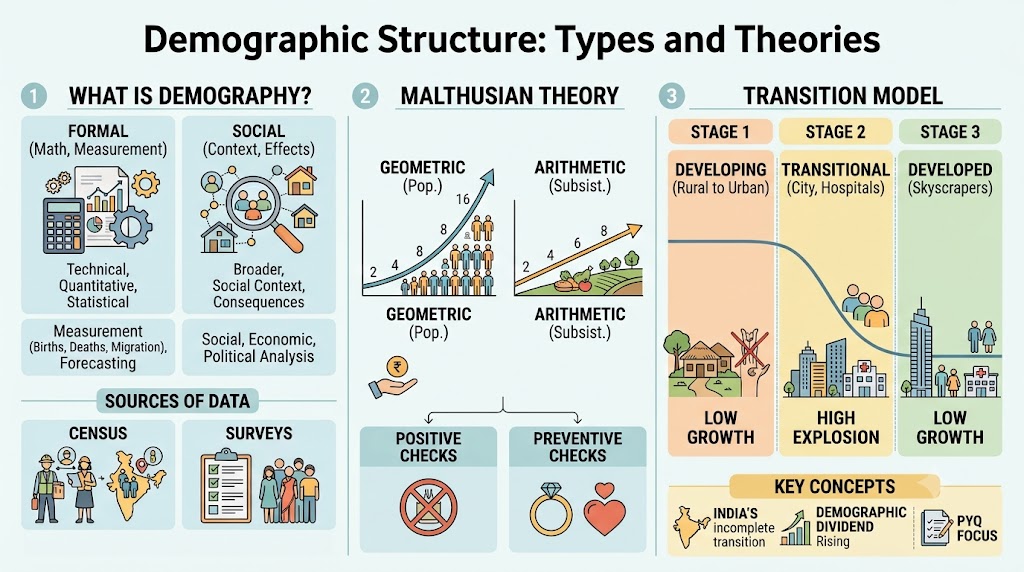
- Formal demography: a narrow, technical, and largely quantitative field. It is primarily concerned with the measurement and analysis of the components of population change — births, deaths, migration, age/sex composition. It relies on a highly developed mathematical methodology, which makes it especially suited for forecasting future population growth and changes in population composition (this forecasting angle is a distinguishing feature examiners like to test).
- Social demography: broader — focuses on the social, economic, and political aspects of populations; concerned with the changes in and consequences of population for society, not just the numbers themselves.
- Social statistics: a related but distinct concept — refers to quantitative data on various aspects of the population and the economy. Aggregate statistics referring to large collectivities of millions of people offer a concrete and strong evidentiary base for the existence of social phenomena that individual-level observation alone cannot establish.
- All demographic study rests on census or survey — systematic enumeration of people in a given territory.
- First modern census: USA, 1790, soon taken up in Europe in the early 1800s. In India, censuses began under British rule (1867–72); decennial (10-yearly) censuses since 1881; independent India's series began in 1951, most recent in 2011.
- India's census is the largest such exercise in the world — China has a slightly bigger population but does not hold regular censuses.
Why demographic data matters (frequent PYQ): it is essential for planning and implementing state policies, especially for economic development and public welfare; aggregate statistics give concrete evidence of large-scale social phenomena that individual observation cannot show.
Malthusian Theory of Population Growth
Proposed by Thomas Robert Malthus, English political economist, in 'Essay on Population' (1798). A pessimistic theory.
- He argued human populations tend to grow far faster than the rate at which the means of subsistence can grow — note this covers more than just food: it includes food, clothing, and other agriculture-based products.
- Population grows in geometric progression (2, 4, 8, 16, 32...) — fast.
- Agricultural/subsistence production grows only in arithmetic progression (2, 4, 6, 8, 10...) — slow.
- Result: humanity is condemned to live in poverty forever, since population growth will always overtake production of the means of subsistence.
- Positive checks: natural/involuntary means that raise the death rate — famines, epidemics, disasters (nature restoring balance).
- Preventive checks: deliberate human control — late marriage, celibacy, sexual abstinence, contraceptives.
Criticism of Malthus (important PYQ area):
- Predictions proved false — from the latter half of the 19th century, birth rates declined and epidemics came under control; both food production and living standards rose despite rapid population growth, thanks to advances in science and technology.
- Liberal and Marxist scholars criticised Malthus for asserting that poverty was caused by population growth. They argued poverty/starvation is caused instead by the unequal distribution of economic resources — an unjust social system lets a privileged minority live in luxury while the majority stay poor.
Theory of Demographic Transition
Links population growth to a country's level of economic development; every society is believed to pass through a common developmental pattern of population growth.
| Stage | Type of Society | Birth Rate | Death Rate | Net Growth |
|---|---|---|---|---|
| Stage 1 | Underdeveloped, technologically backward | High | High | Low — both rates are high, so the difference (net growth) between them stays small |
| Transitional Stage | Society moving from backward to advanced (e.g., India) | Stays high | Falls relatively quickly | Very high — this gap between quickly-falling death rate and slowly-falling birth rate is exactly what produces 'population explosion' |
| Stage 3 | Developed society | Low | Low | Low again — both rates reduced considerably, difference between them small once more |
- Note the logic carefully: growth is low in both Stage 1 and Stage 3, but for opposite reasons (both rates high vs both rates low). It is only the transitional stage in between that produces very high growth — this is a common trap in MCQs that ask to identify which stage causes explosion.
- Population explosion happens because death rates are brought down relatively quickly via advanced disease control, public health, and nutrition — but it takes longer for society to adjust its reproductive behaviour (evolved during the earlier period of poverty/high death rates) to suit the new situation of relative prosperity and longer life spans.
- India's transition is still incomplete: mortality rate has dropped sharply, but the birth rate has not fallen to the same extent.
- Demographic Dividend: when the working-age population grows larger relative to the dependent population — a temporary window that benefits economic growth if converted into real growth via education and employment.
Key Demographic Indicators & Definitions (high-yield for CUET)
| Term | Definition |
|---|---|
| Birth Rate | Number of live births per 1000 population in a given area/year |
| Death Rate (Mortality Rate) | Number of deaths per 1000 population in a given area/year |
| Rate of Natural Increase | Difference between birth rate and death rate |
| Fertility Rate | Live births per 1000 women in the child-bearing age group (15–49 yrs) — a 'crude' rate, ignores age-group differences |
| Total Fertility Rate (TFR) | Total number of live births a hypothetical woman would have if she lived through her entire reproductive span at the age-specific fertility rates of that area |
| Infant Mortality Rate (IMR) | Deaths of infants below age 1, per 1000 live births |
| Maternal Mortality Rate (MMR) | Number of women who die during childbirth, per 1,00,000 live births |
| Sex Ratio | Number of females per 1000 males |
| Age Structure | Proportion of population in different age groups: 0–15 (youth), 15–64 (working), above 64 (dependent/aged) |
| Dependency Ratio | (Population below 15 + above 64) ÷ Population aged 15–64, expressed as % |
- Replacement Level: population is 'stabilised' when the difference between birth and death rate is zero — new generation exactly replaces the old.
- Negative Growth Rate: fertility below replacement level — seen in Japan, Russia, Italy, Eastern Europe.
- High IMR/MMR signals backwardness and poverty; improvement signals better medical facilities, education, and prosperity.
Size, Growth and Age Structure of India's Population
- India is the second most populous country in the world, after China.
- Before 1931: both birth and death rates were high. After this turning point, death rates fell sharply while birth rate fell only slightly — the classic transition mismatch.
- Decline in death rate after 1921 mainly due to control over famines and epidemics (fevers, plague, smallpox, cholera) via medical cures, mass vaccination, and improved sanitation.
- Famine causes: natural (excess/no rainfall, drought) and man-made (over-use of pesticides/fertilizers, poor transport/distribution). Amartya Sen's key insight: famine is often not due to lack of food grain but due to failure of distribution/entitlements and people's inability to buy or access food.
- NREGA (MGNREGA): rural employment guarantee scheme, latest state initiative addressing hunger/starvation.
- India has a very young population — average age below most other countries — believed to give India a demographic dividend, similar to East Asian economies earlier and Ireland later.
- Wide regional variation: Kerala is developing an age structure like developed countries; Uttar Pradesh has a much younger, high-birth-rate profile. India overall sits in between.
- Population pyramids (age-structure diagrams) are the standard tool for visualising this. Comparing India's pyramids across 1961, 1981, 2001, and the 2026 projection shows the shape shifting from a broad-based triangle (wide young base, narrow old-age top — typical of high birth/death rate societies) toward a more rectangular, top-heavier shape by 2026 (narrower base as birth rate falls, wider middle/upper bands as more people survive into working and older age). A widening middle of the pyramid reflects a growing working-age population — the visual signature of the demographic dividend.
Fertility Rate Variations in India
- Birth rate is a sociocultural phenomenon, changes slowly compared to death rate.
- States that brought TFR down to 1.7 (2016) — below replacement level: Andhra Pradesh, Himachal Pradesh, Punjab, Tamil Nadu, West Bengal; Kerala's TFR is also below replacement level.
- States with very high TFR (2016): Bihar (3.3), Madhya Pradesh (2.8), Rajasthan (2.7), Uttar Pradesh (3.1).
- India's total birth rate (Economic Survey 2018–19): 22.4 overall; rural 22.4, urban 17.3.
- Highest state birth rates: Bihar (26.4) and Uttar Pradesh (25.9) — together projected to contribute about 50% of India's population addition up to 2041.
Declining Sex Ratio in India
Sex Ratio: number of females per 1000 males. Naturally, 943–952 female births per 1000 male births is considered favourable to females (girls have infancy-disease resistance advantage; women tend to outlive men).
- Historical trend: 972 (1901) → declined to 933 (2001, turn of century) → 943 (Census 2011) — a slight recovery but still a century-long decline overall.
- Countries like China, South Korea, and India show declining sex ratio due to 'son preference' and neglect of the girl child.
- Child sex ratio is worse: Haryana worst at 793 (only state below 800), followed by Punjab, Jammu & Kashmir, Delhi, Chandigarh, Uttarakhand, Himachal Pradesh — all under 900.
- Highest child sex ratio: Arunachal Pradesh at 972; even Kerala (best overall sex ratio) manages only 964 for children.
- Key PYQ point: prosperous states (Maharashtra, Punjab, Haryana, Chandigarh, Delhi) have high per capita income but low child sex ratio — proving selective abortion is not caused by poverty or lack of resources. It may instead be linked to smaller family-size choices where families still want to select the sex of their (fewer) children.
Causes of decline: neglect of girl infants → higher infant death rates; sex-specific/selective abortions; female infanticide.
Policy response:
- Pre-Natal Diagnostic Techniques (Regulation and Prevention of Misuse) Act — in force since 1996, strengthened in 2003; bans sex determination, imposes fines/imprisonment.
- Beti Bachao, Beti Padhao — government programme to improve child sex ratio.
Literacy
- Literacy: ability to read and write; treated as a prerequisite to education and an instrument of empowerment.
- Post-independence: roughly two-thirds of India's population is now literate, though improvement struggles to keep pace with population growth.
- Three key dimensions of literacy inequality tested in exams: gender (male literacy higher, though the gap is narrowing), social group (SC/ST and lower-income groups lag, government tries to bridge gap via reservation), and region (Kerala near-universal literacy vs Bihar/Rajasthan lagging).
- These inequalities matter because they reproduce inequality across generations.
Rural–Urban Differences and Migration
- As per Census 2011: 68.8% population rural, 31.2% urban — rural population still larger in absolute numbers, but urban share is rising.
- Agriculture, once the largest GDP contributor, now contributes only about one-sixth of GDP, though rural areas still have many non-agricultural activities (post office, teaching, small trade, transport).
- Mass media spreads urban lifestyle images into villages, creating new consumption aspirations; mass transit/communication is bridging the rural-urban gap.
- Reasons for rural-to-urban migration: search for work when rural employment is insufficient; decline of common property resources (ponds, forests, grazing lands) that earlier let land-poor people survive; anonymity of cities gives SC/ST groups partial protection from caste-based daily humiliation faced in villages; anonymity also lets dominant-caste poor take up low-status jobs they couldn't do in their village.
- Metropolis vs Megapolis: a metropolis is a city with its distinct suburbs; a megapolis includes the city and its surrounding suburb region as one unit (e.g., NCR).
- India has 5,161 towns/cities housing 286 million people; more than two-thirds of the urban population lives in the 27 million-plus cities.
Population Policy in India
- India was the first country in the world to explicitly announce a population policy, in 1952, via the National Family Planning Programme (NFPP).
- Core objective: influence the rate and pattern of population growth in a socially desirable direction — reduce birth rate through birth control methods, improve public health, raise awareness.
- Emergency period (1975–76, under Indira Gandhi): fundamental rights suspended, press censored, arrests without trial. Sanjay Gandhi (younger son of PM Indira Gandhi) launched a mass sterilization programme — tubectomy for women, vasectomy for men — conducted coercively/haphazardly; government teachers and doctors were pressured to meet sterilization targets.
- Programme later renamed National Family Welfare Programme (NFWP) — post-Emergency, sterilization made voluntary, requiring the individual's own signed consent.
- 2017: Government introduced the National Health Policy 2017, incorporating updated socio-demographic goals and targets.
Common Mistakes
- Confusing 'Fertility Rate' (a crude average per 1000 women, ignoring age-groups) with 'Total Fertility Rate' (accounts for a woman's full reproductive lifespan) — these are frequently swapped in MCQs.
- Assuming declining sex ratio and selective abortion are caused by poverty — the chapter explicitly states prosperous states like Punjab, Haryana, Delhi have low child sex ratios, disproving this.
- Mixing up Malthus's own theory with the Liberal/Marxist critique of it — remember Malthus blamed population growth for poverty, while his critics blamed unequal distribution of resources.
- Misremembering the Demographic Transition stages — the 'population explosion' happens specifically in the TRANSITIONAL stage between Stage 1 and Stage 3, not in Stage 1 or Stage 3 themselves (both of those have LOW net growth, for opposite reasons).
- Forgetting that India's Census was first held under British rule (1867–72, regular since 1881), not starting in 1951 — 1951 is only when independent India's census series began.
- Reducing Malthus's 'means of subsistence' to just food — the original argument includes clothing and other agriculture-based products too.
- Treating 'social statistics' and 'formal demography' as the same thing — social statistics is the quantitative data itself, formal demography is the mathematical discipline that analyzes such data for forecasting.