
The Big Questions
Q1. What is demography?
Answer:
Demography is the study of the composition of human population in terms of different factors like age, sex, occupation, religion, education, and how these characteristics change over time. It also involves analyzing population size, structure, and distribution, and the processes of birth, death, and migration that shape population dynamics.
Q2. What are some important concepts of demography?
Answer:
Some important concepts of demography include:
- Birth Rate: The number of live births per 1,000 people in a population in a year.
- Death Rate (Mortality Rate): The number of deaths per 1,000 people in a population in a year.
- Fertility Rate: The average number of children a woman is expected to have in her lifetime.
- Replacement Level Fertility Rate: The fertility rate required to maintain a stable population (approximately 2.1 children per woman).
- Life Expectancy: The average number of years a newborn is expected to live under current health and living conditions.
- Migration: The movement of people from one place to another within or across countries.
- Population Composition: The structure of a population based on characteristics such as age, gender, education, and occupation.
- Sex Ratio: The number of females per 1,000 males in a population.
Q3. How has the population of India and the world changed over time?
Answer:
World Population: World population grew from 2.5 billion in 1950 to 8.2 billion in 2025 and is expected to reach 9.7 billion by 2050. This growth has been driven by improved healthcare, better nutrition, and medical advancements. However, growth has slowed over time, and the population is projected to peak at around 10.3 billion by the mid-2080s before gradually declining.
India's Population: India's population has grown rapidly since independence. In 2023, India surpassed China to become the world's most populous country. The population growth trajectory has changed over time: from slow growth (1901-1921), to rapid growth (post-1951), and now a slower growth rate as fertility rates have declined. India's population now constitutes around 17 per cent of the world population.
Q4. How do population trends shape societies and economies?
Answer:
Population trends significantly shape societies and economies in various ways:
- Economic Growth: A large working-age population (demographic dividend) can boost economic growth if adequately educated and employed.
- Resource Allocation: Population size and structure determine the demand for and allocation of resources like schools, hospitals, housing, and infrastructure.
- Healthcare and Social Services: An ageing population requires more healthcare facilities, pensions, and elderly care services, while a young population requires more schools and childcare.
- Labor Market: The size and age structure of the population affect the availability of workers and can lead to labor shortages (in ageing populations) or high unemployment (in very young populations).
- Migration: Population movements from rural to urban areas or across countries can lead to urbanization, strain on city infrastructure, and changes in cultural and social dynamics.
Let's Explore
Q1. Ask your family members if they have observed any of the following changes around them over the years: farmland or green spaces being turned into new buildings for housing; more crowded streets; more cars and buses; and traffic congestion; in public spaces changing types of homes (e.g., smaller apartments, more single-family homes). What could be the possible reasons behind these changes?
Answer:
This is a research and observation activity. The reasons behind these changes include:
- Population Growth: An increase in population leads to a higher demand for housing, leading to the conversion of farmland and green spaces into residential areas.
- Urbanization: People migrating from rural areas to cities for better opportunities increase the population density in urban areas, leading to more crowded streets and traffic congestion.
- Economic Development: Increased economic activity leads to more vehicles on the road.
- Changing Lifestyles: More people prefer smaller apartments or single-family homes in urban settings due to cost and convenience.
Q2. Why is the replacement rate 2.1 and not 2 (parents get replaced by children)? What are the situations in which the replacement rate can be higher?
Answer:
The replacement rate is 2.1 and not 2 because not all children survive to adulthood and reproduce. The additional 0.1 accounts for child mortality and the fact that some people may not have children. The replacement rate can be higher in countries with high child mortality rates, where more children need to be born to ensure that enough survive to replace the parents.
Q3. Observe fertility and literacy rates in select Indian states in Fig. 6.11. Do you find a relationship between the two indicators? Prepare a report on your observations and possible reasons for the same. 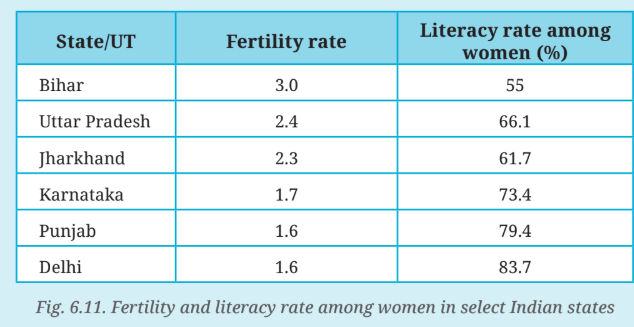
Answer:
Observation: There is an inverse relationship between fertility rates and female literacy rates in select Indian states. States with higher female literacy rates (e.g., Delhi, Punjab, Karnataka) have lower fertility rates, while states with lower female literacy rates (e.g., Bihar, Uttar Pradesh, Jharkhand) have higher fertility rates.
Possible Reasons:
- Education and Awareness: Educated women are more aware of family planning methods and have better access to healthcare.
- Empowerment: Educated women are more likely to participate in the workforce and make decisions about family size.
- Age of Marriage: Educated women tend to marry later, reducing the number of childbearing years.
- Economic Opportunities: Higher education and employment opportunities lead to smaller families due to the higher cost of raising children.
Q4. Census figures of 2001 as well as 2011 show the overall number of females per 1,000 males being much less than 1,000. Some states, however, had over 1,000 or near 1,000 (Kerala, Puducherry, Tamil Nadu). What might be the reasons for this?
Answer:
The higher sex ratio in states like Kerala, Puducherry, and Tamil Nadu can be attributed to:
- Higher Female Literacy: Higher levels of education among women lead to better health awareness and care.
- Better Healthcare: Better healthcare and nutrition facilities reduce female mortality.
- Lower Son Preference: These states have relatively lower son preference and sex-selective practices.
- Social and Cultural Factors: More progressive social norms and greater gender equality.
- Urbanization: Higher urbanization often correlates with better healthcare and education, leading to a more balanced sex ratio.
Think About It
Q1. If many young people migrate from villages or smaller towns to cities, what changes could take place in their native villages?
Answer:
If many young people migrate from villages to cities, the native villages could experience:
- Ageing Population: The village population would become older, as young people leave and the elderly remain.
- Shortage of Labor: There would be a shortage of workers for agriculture and other local economic activities.
- Decline in Services: Schools and other services may suffer due to a lack of young children and families.
- Reduced Economic Growth: The village economy may stagnate or decline due to a lack of young entrepreneurs and workers.
- Cultural Change: Traditional practices and community life may weaken as the younger generation leaves.
Q2. If the replacement rate is less than 2, what will the population pyramid look like? Will there ever be a situation where the number of children is less than the number of aged people? What is likely to happen to the population of such a country over time?
Answer:
If the replacement rate is less than 2, the population pyramid will become inverted, with a narrow base (fewer children) and a wider top (more elderly people). Yes, in countries with very low fertility rates and high life expectancy, the number of elderly people can exceed the number of children. Such a country's population is likely to shrink over time, leading to an ageing population, labor shortages, and pressure on healthcare and pension systems.
Don't Miss Out
Q1. While the term 'population pyramid' is used widely, the representation on paper looks more like a triangle, parts of which have been pulled outwards or shrunk, into different shapes—a 3-dimensional concept represented in 2 dimensions.
Answer:
This is an observation note. A population pyramid is a graphical representation of the age and sex composition of a population. It is called a pyramid because in many developing countries with high birth rates, it has a broad base (many young people) and narrows towards the top (fewer elderly). However, the shape varies; in countries with low birth rates, the shape can be more rectangular or even inverted.
Questions and Activities
Q1. Why is it important for a country to study its population through demography?
Answer:
It is important for a country to study its population through demography because:
- Planning and Development: It helps governments plan infrastructure such as schools, hospitals, roads, and housing based on the population's age and composition.
- Resource Allocation: It helps in the efficient allocation of resources like water, energy, and healthcare.
- Economic Planning: It provides data for economic planning, employment generation, and fiscal policy.
- Policy Making: It helps in formulating policies on education, health, and social welfare.
- Predicting Future Trends: It allows governments to anticipate challenges like an ageing population or a youth bulge and prepare accordingly.
Q2. How can a low fertility rate affect a country's future economy and workforce?
Answer:
A low fertility rate can affect a country's future economy and workforce in several ways:
- Shrinking Workforce: Fewer young people entering the workforce can lead to labor shortages, which can slow economic growth.
- Ageing Population: An increase in the elderly population puts pressure on healthcare and pension systems, increasing government expenditure.
- Reduced Innovation: A less dynamic workforce may lead to lower innovation and productivity.
- Economic Slowdown: With fewer workers and more dependents, the economy may slow down, as seen in countries like Japan.
- Increased Taxes: To support the growing elderly population, taxes may increase, which can further affect economic growth.
Q3. Do you think a high birth rate is always good for a country? Why or why not?
Answer:
A high birth rate is not always good for a country. While it can provide a young and growing workforce (demographic dividend), it also poses challenges:
- Resource Pressure: High birth rates put pressure on resources like food, water, housing, and education.
- Unemployment: If the economy cannot create enough jobs, a large young population can lead to high unemployment.
- Infrastructure Strain: It can strain infrastructure like schools, hospitals, and public transport.
- Poverty: Large families may struggle to provide adequate nutrition, healthcare, and education for all children.
Therefore, a balanced population growth that matches economic growth is ideal. Countries need to manage birth rates through education and family planning to ensure sustainable development.
Q4. Do you think it's better to have more people or fewer people in a country? What are the challenges countries face in the case of a fast-growing or shrinking population?
Answer:
There is no simple answer to whether it's better to have more or fewer people. The ideal population depends on the country's resources, economic capacity, and development goals. Both fast-growing and shrinking populations present challenges:
Challenges of a fast-growing population:
- Pressure on resources (food, water, energy).
- Strain on infrastructure and public services.
- Unemployment and underemployment.
- Poverty and inequality.
Challenges of a shrinking population:
- Labour shortages and reduced economic growth.
- Ageing population and pressure on healthcare and pensions.
- Lower innovation and productivity.
- Potential for economic stagnation or decline.
A country needs to aim for a stable population that supports sustainable development.
Q5. How does the age structure of a country affect the kind of jobs and services it needs? Explain with examples.
Answer:
The age structure of a population determines the demand for specific jobs and services.
- Young Population (Broad Base): A country with a high proportion of children and young people needs more schools, teachers, childcare, and pediatric healthcare services. For example, India has a large young population, requiring significant investment in education and skill development.
- Working-Age Population (Wide Middle): A country with a large working-age population (15-64 years) needs more employment opportunities, job training, and industries. It also requires transportation and housing for the workforce. For example, countries experiencing a demographic dividend need to create jobs for this cohort.
- Ageing Population (Wide Top): A country with a high proportion of elderly people needs more healthcare facilities, geriatric care, pension schemes, and old-age homes. For example, Japan has an ageing population and has developed technology and services for elderly care.
Q6. Why do you think families are generally getting smaller? Does having fewer children ensure better education and health for them? How does it affect families and society?
Answer:
Families are getting smaller because of several factors:
- Education: Particularly among women, education leads to later marriage and fewer children.
- Urbanisation: Higher costs of living in cities make it more difficult to raise large families.
- Economic Considerations: Smaller families allow parents to invest more resources in each child's education and health.
- Family Planning: Better access to contraception and family planning services.
- Changing Social Norms: There is less pressure to have many children, and smaller families are often seen as preferable.
Having fewer children can ensure better education and health for each child, as parents can allocate more time, attention, and resources to them. However, smaller families can affect society by leading to an ageing population, reduced workforce, and changed family dynamics. It can also affect kinship networks and the traditional support systems provided by larger joint families.
Q7. Observe the graph below showing changes in life expectancy across gender in India and answer the questions given below: a) Has the life expectancy in India increased? If yes, what could be the reasons? b) What was the life expectancy of males and females in 2010?
Answer:
a) Yes, life expectancy in India has increased significantly. Reasons include:
- Better healthcare and access to medical facilities.
- Improved nutrition and living conditions.
- Reduction in child mortality and infectious diseases.
- Increased awareness about health and hygiene.
- Advances in medical technology and treatments.
b) Based on typical data, in 2010, the life expectancy at birth for females was around 68 years, and for males, it was around 64 years. (Students should refer to the specific graph provided in their textbook for exact figures.)
Q8. What is a demographic dividend, and how does it benefit a country? What do you think India needs to do today to make the most of its demographic dividend before 2050?
Answer:
Demographic Dividend: It is the economic growth potential that results from a country having a younger and productive age structure—a large working-age population relative to dependents (children and elderly). This allows for higher economic output, savings, and investment.
Benefits:
- Higher productivity and economic growth.
- More tax revenue for government spending on infrastructure and services.
- Increased savings and investment.
- Potential for innovation and entrepreneurship.
What India needs to do to make the most of its demographic dividend before 2050:
- Invest in Education: Ensure quality education and skill development for the young population to make them employable.
- Create Jobs: Generate sufficient employment opportunities in various sectors.
- Improve Healthcare: Ensure access to quality healthcare to maintain a healthy workforce.
- Promote Skill Development: Provide vocational training and upskilling to match industry needs.
- Support Women's Empowerment: Increase female labor force participation and address the 'double burden' they face.
Q9. Choose two countries (for example: India and Japan, or Nigeria and Italy). Find out their: Population size; Fertility rate; Life expectancy; Age distribution. How are they different? What might be the reasons behind these differences? For instance, find out how countries with ageing populations are managing this.
Answer:
This is a research activity. For example, comparing India and Japan:
India: Population 1.44 billion; Fertility Rate 1.9; Life Expectancy 70; Age Distribution: Young (large under-15 population), expanding working-age population.
Japan: Population 123 million; Fertility Rate 1.0; Life Expectancy 84; Age Distribution: Ageing (large elderly population, shrinking working-age).
Differences and Reasons:
- India has a younger, growing population, while Japan has an ageing, shrinking population.
- India's higher fertility rate is due to lower levels of female education and urbanization in some regions, while Japan's low fertility rate is linked to high urbanization, education, and career-oriented women.
- Japan's high life expectancy is due to advanced healthcare and a healthy lifestyle.
How countries with ageing populations are managing: Japan is raising retirement ages, using technology and automation to address labor shortages, and implementing community-based care and AI-assisted elderly care.
Q10. Imagine you are a researcher who intends to study migration patterns in your locality. Make a questionnaire to collect data on the following questions.
Answer:
This is a research activity. A sample questionnaire on migration patterns could include:
- What is your age and gender?
- Where were you born?
- Where do you currently live?
- How long have you lived in your current locality?
- Why did you move to this place? (e.g., employment, education, marriage, natural disaster, family, etc.)
- Are you planning to move again in the near future?
- What are the main challenges you faced when you moved?
- What are the main facilities you found better in this place?
Q11. Draw a population pyramid on graph paper for India using the data given in the following table.
| Age Group | Male | Female |
|---|---|---|
| 0-4 | 8.6 | 8.2 |
| 5-9 | 8.9 | 8.4 |
| 10-14 | 8.7 | 8.6 |
| 15-19 | 9.3 | 9 |
| 20-24 | 9.5 | 9.1 |
| 25-29 | 9 | 8.6 |
| 30-34 | 8.1 | 8 |
| 35-39 | 7.1 | 7.4 |
| 40-44 | 6.3 | 6.7 |
| 45-49 | 5.7 | 6 |
| 50-54 | 5 | 5 |
| 55-59 | 4.2 | 4.2 |
| 60-64 | 3.2 | 3.3 |
| 65-69 | 2.4 | 2.7 |
| 70-74 | 1.8 | 2.1 |
| 75-79 | 1.2 | 1.4 |
| 80+ | 0.9 | 1.2 |
Answer:
This is an activity. Students should plot a population pyramid on graph paper. The male population is plotted on the left side and female on the right side, with age groups on the vertical axis. The shape of the pyramid will show a broad base (young population) and gradually tapering towards the top, characteristic of a developing country with a high proportion of young people.
Q12. Observe the population pyramid for Japan in 2023 below. What can you infer from this? Write your observations and share in the class.
Answer:
This is an observation activity. The population pyramid for Japan would show:
- A narrow base, indicating low birth rates and fewer children.
- A wide middle and top, indicating a large working-age and elderly population.
- A higher proportion of females in older age groups, reflecting higher female life expectancy.
This indicates that Japan has a low fertility rate, high life expectancy, and is facing an ageing population and a shrinking workforce. The country will need to address issues like labor shortages, healthcare costs, and pension sustainability.